Complete Guide to Forex Indicators
Forex Indicators are the bread and butter for every technical analysis trader. Through mathematical equations, they compress hundreds of hours of price movement into charts and histograms that guide hundreds of buy and sell decisions worldwide.
They influence trader decisions and, by extension, the foreign exchange market. Every beginner trader should understand how they work before trying their hand at trading.
For the rest of this article, we shall talk about the different forex indicators used by pro traders, how to use them, and find the best one that fits your trading style and strategy.
What is a forex Indicator?
Forex Indicators are complex mathematical tools designed to help traders understand price movements and capitalize on them. They are invaluable tools in price analysis trading, and they use historical prices and volumes to help you track trends and possibly predict price movement. They display the result of their calculations on top of the moving price or the bottom of our window.
Traders often use one or more indicators while they are trading before making a buy or sell order. Their effectiveness multiplies when combined with Price action analysis and practical knowledge gained from studying charts, patterns, market hours, and taking trades. Regardless, they are still surprisingly effective as a standalone price analysis tool. In fact, Professional traders and even newer ones base their trading strategies around technical indicators alone.
What are the four types of Technical indicators?
There are hundreds of indicators available across numerous foreign exchanging platforms, each with its specific use. However, not every single one is very practical or frequently used.
Forex indicators are divided into four main categories based on their functionality and the kind of information they provide. They include:
- Trend following Indicator
- Trend confirmation indicator
- Overbought and Oversold Indicator
- Profit taking indicator
Ideally, you want to master one or more indicators from these four categories and use them in your market technical analysis while you trade. Even with the basic categories, it can still be difficult to choose the best forex indicators.
Trend following Indicator (Moving Average)
For forex traders who don’t trade against the trend, trend following indicators helps them identify trends and confirm whether they are bullish or bearish. They can help you determine whether to enter for a long position or a short one. The Moving averages indicator is one of the best forex indicators for monitoring trends.
Moving Average Indicator
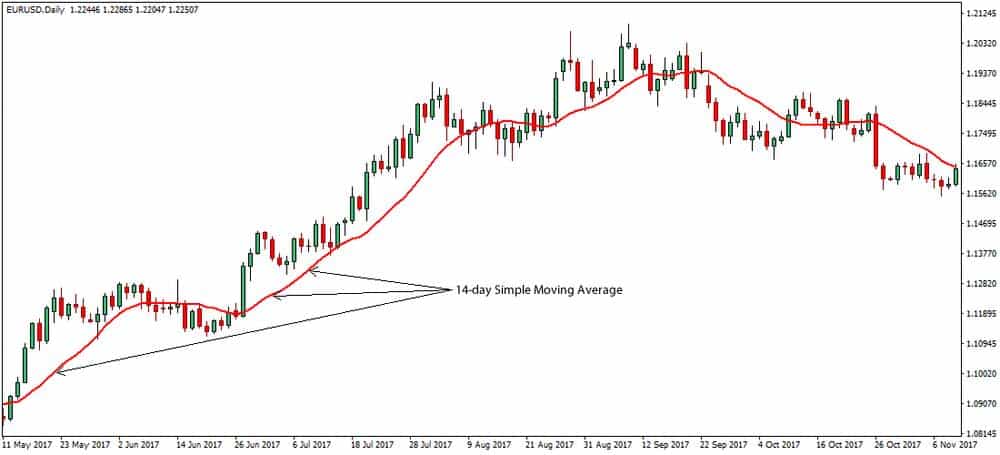
Moving averages work by calculating the average of the closing price on a price chart for a selected period of time. They are invaluable to a trader because they smooth out the price and show you the overall direction of the price through the average of the closing prices for each day.
How to use the Moving Average Indicator
Moving average indicators tend to lag the longer the time period they are set to. So, a 100-day will suffer less lag than a 20-day moving average. So, short term traders favor low period moving averages, and long-term traders focus more on longer periods.
Moving averages are completely customizable and can be configured to display different time periods. The most popular are 15, 20, 30, 50, 100, and 200 days.
Professional traders often set their moving averages at two time periods- one high and one low. This way, they can keep an eye on the price chart on their preferred period and exploit crossover when they see them.
Shortcomings of the moving Average
The moving average is great for confirming the security of a trend during technical analysis but they are not great buy and sell signals. The lag or whiplash can be very misleading, and it oftentimes shines best in the company of other types of indicators.
Moving averages also form the base of other popular technical analysis indicators too. The Moving average convergence divergence (MACD), Simple moving average, Exponential moving average are all great trend and signal indicators too.
Trend Confirmation Indicator
The trend confirmation offers traders a second pair of eyes on the price chart. They confirm the direction of the trend and reinforces the trader’s technical analysis. If the trend confirming tool and trend checking tools match, then the trader is one step closer to taking a trade, whether buy or sell. Otherwise, they need to step back and reconsider their analysis.
Moving Average Divergence convergence (MACD)
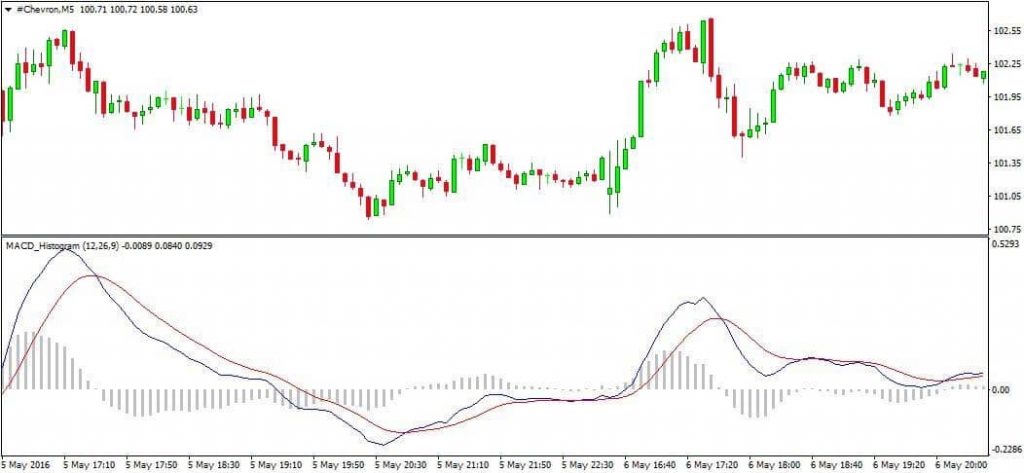
The Moving average divergence and convergence or MACD indicator is a great trend confirmation indicator for the job. It works by calculating the difference between the shorter moving average and the longer one. MACD lines are constantly converging towards or diverting from each other, and that causes them to oscillate around the 0 value.
Whenever the MACD values are significantly above or below the zero lines, then those are signs that the currency pair is currently being overbought or sold, and the trend is confirmed.
Overbought and oversold indicators
With the aid of a proper trend confirming tool, it is possible to determine the overall direction of the trend. However, that tool does not accurately tell you what entry times or time frames are best for you. That is where a predominant overbought and oversold tool comes in handy.
Overbought and oversold indicators will help forex traders easier decide to either buy into the market immediately or wait for another pullback on the trend. Both offer similar opportunities and rewards as far as trading is concerned and finding the perfect entries rely on trading experience more than anything else.
There are dozens of indicators that fit this bill. However, one of the best, in our opinion, is the three- RSI or three-day relative strength index indicator.
RSI indicator
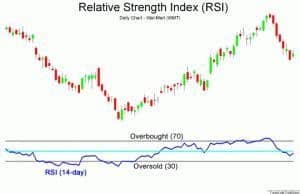
The RSI indicator was developed by J-Welles Wilder, and it is a momentum oscillator that calculates the speed and changes in the price of a currency pair or stock over a given time frame. The RSI is displayed at the bottom of the charts with two lines, one at the top and bottom.
How to Use the RSI indicator
Traditionally, a pair or stock is said to be overbought when it rises above the upper 70-line and oversold when it falls below the lower 30-line. If it hovers between those two and nearer to 50, it is ranging.
The RSI indicator is also sometimes actionable patterns that are not evident in the main chart themselves, such as double bottoms and even trend lines. They could function effectively as a type of trading signal if the other indicators match up.
In uptrends and downtrends, the RSI indicators behave differently. In uptrends, they remain around the 40-90 range and fall to the 40-50 zones for support. While in downtrends, the reverse is the case. They stay around the 10-60 range and test the mid-zones as levels of resistance.
Profit-taking indicators
After you’ve taken a successful trade and made quite a bit of money. It’s important to know where and when to take profit. An incorrectly placed take profit could cost even the most experienced traders several pips in potential profit and could even lead to a catastrophic loss.
Several indicators come to mind while discussing this particular issue. The three-day RSI indicator, in particular, could serve as an effective signal. New highs and lows could be a clear sign to take profit. However, an indicator that is even better is Bollinger Bands.
Bollinger Bands
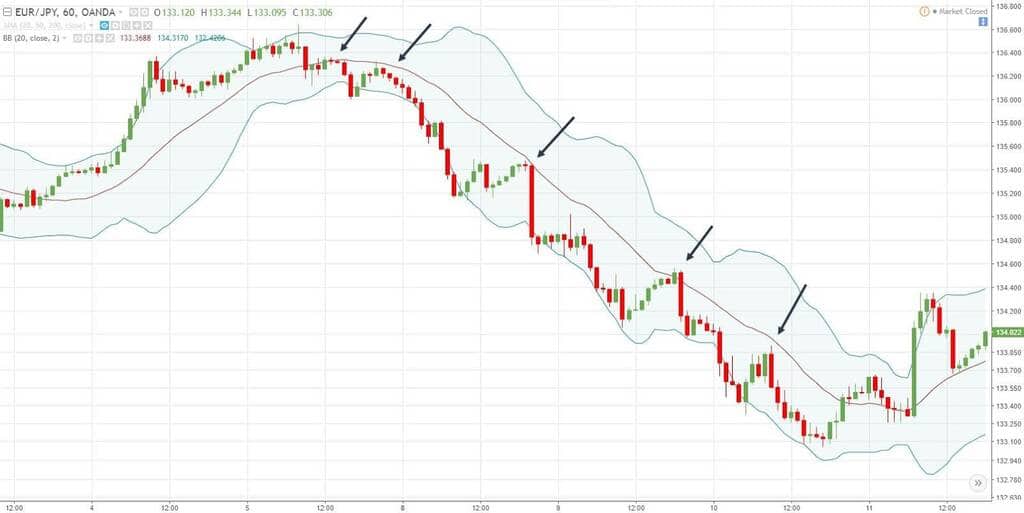
Bollinger bands use price envelopes plotted at standard deviation levels to calculate the moving average of a price. This indicator was developed by John Bollinger, and they adjust to volatility swings prices.
Bollinger Bands operate using two parameters: period and standard deviation. Many traders set the default values at 20 for period and 2 for standard deviation and frequently customize the combinations at later points to meet their specific needs.
They are used to determine if the prices on a chart are high or low on a relative basis and are used with the Moving Average indicator or other types of indicators to confirm signals and set up buy and sell trades.
They are an extremely versatile indicator whose uses far extends just profit-taking.
How to use Bollinger Bands
Bollinger is useful for technical analysis and predicting the direction a specific currency pair might sway in.
In periods of low volatility, Bollinger bands shrink appropriately, and for some traders, that is a clear signal of a new trend. However, it could also possibly be a false breakout and could be catastrophic to your account.
When the Bollinger bands expand greatly, and there is a great deal of volatility, it might be signs that a trend is ending, and you might want to exploit that.
Prices bounce off the bottom and top Bollinger bands from time to time. If studied correctly and paired with other great indicators, they could be used to set potential take profit estimates or targets. For example, if the price bounces of an upper or lower band, cross the moving average, then the opposite bands should be the profit target.
During an up or downtrend, the trend lines sometimes hug the bottom or top of the bands for extended lengths of time. Traders typically take this as a take profit sign. They sometimes pair them with other indicators so as not to set take profit too soon or late, but that generally constitutes a sufficient signal.
Another popular signal with Bollinger bands is a lengthy deviation from the established trend. When this happens, it is usually a sign of a strong trend, and after you’ve confirmed it with a series of other indicators, you can set your take profit at a higher point on the trend. However, it is not uncommon for the price to dip or retract if the prolonged deviation didn’t last for long.
As with most indicators, the Bollinger bands don’t send infallible signals. However, they do allow traders, beginners, and more experienced to better understand the market and make appropriate decisions.
Why are indicators so powerful?
Indicators are powerful trade filtering tools at their core. They provide mostly accurate signals that can help you make a net profit as a beginner at forex trading. With them, most suspicions, opinions, and theories you have about the market could be immediately confirmed and sometimes acted upon. Inversely, they could also alert you to potential blunders and save you money while you trade.
They are suitable for all investors, but they are not perfect. As we’ve already mentioned, indicators sometimes give false signals. While that could be potentially weeded out with other great indicators, the problems still remain. The true reason why indicators are so powerful is because of the potential they are combined with pure price data or action analysis.
What is Price action analysis?
Price action analysis involves reading, watching, and interpreting price charts over time to predict the future movement of the market. During pure price action analysis, no indicators are used, only lines, Fibonacci tools, and trend lines.
It is based on the fundamental philosophy of not just seeing the market as a separate entity but also recognizing trader bias, market sentiment, and recurring patterns. Price action traders take trades based on the summations drawn from price action analysis and are said to truly understand the market.
Combining price action and Technical Analysis
Though some traders might tell you otherwise, technical analysis and, by extension, indicators, draw their summations, conclusions, and signals from price data analysis. To some traders, it is a more cluttered form of price action, but we think otherwise.
While a price action analysis is indispensable and will often separate amateur traders from the true professionals, there is a case to be made for indicators. Price action analysis might make trading simpler, but it is not accurate- no trading method is.
Its shortcomings and the shortcomings of every other type of trading strategy can be bridged with the supplementation of other tools. In this case, we mean forex indicators. Indicators offer clean mathematical summations of price action, and that could help reinforce your analysis on future market behavior and take more trades.
Perhaps you are unsure of a trend formation despite looking at the price action, a great trend following indicator could validate your suspicions. Or you need to set a take profit, and while your price analysis is solid, you’d prefer the second set of eyes.
To truly understand the price chart, and make smarter trades, you need to fully understand indicators, pattern formation, and just about every other major analysis tool or method in forex. The market is constantly evolving, and you have a passable knowledge of strategies to excel.
Why Do You Need Forex Indicators While You Trade?
You need forex indicators while you trade to help you confirm your analysis of the market. Beginners and even expert traders don’t have unquestionable knowledge of the market. They make mistakes too sometimes, and the best way to prevent all slip-ups and potential mistakes is to use indicators to confirm your analysis. They help you better see patterns in the market and open your mind to the opportunity many traders often miss.
What are the best forex indicators?
There is no single, most accurate indicator. Forex indicators were designed to be combined and used with each other in trading strategies. No single indicator will keep down your overall risk and drastically increase the size of your account. Relying on a single indicator will only lead to overall losses in the longer term.
What Indicators Do Professional Traders Use?
The forex market moves, on average, about $4 trillion dollars every day. The sheer number of that sum shows you just how many traders are involved in the markets every day.
Millions of traders use different forex indicator combinations in their trading strategies, but the best of the best rely on combinations of basic indicators to make their profit. Some of the most popular indicators that professional traders use are:
- Moving Average
- Exponential moving average
- Stochastic oscillator
- Moving average convergence divergence (MACD)
- Bollinger bands
- Relative strength index
- Fibonacci retracement
- Ichimoku cloud
- Standard deviation
- Average directional index
Backtesting: The Most Important Trading Tip Every Trader Should Know
Suffering losses with any set of indicators or trading strategy is a given. What truly matters are how profitable your strategy is in the long run. To test that out, traders backtest the markets to see how sustainable and profitable their strategies are, given enough time.
Backtesting eliminates the uncertainty that comes with adopting a fresh strategy. Rather than risk their account testing markets in real-time. They look to the past and see how well it would have performed. Numerous trading platforms carry charts that date years back available for free use.
Backtesting alone will not make you a better trader. You must also study how well your strategies perform in the price market. Not until you’ve used those two standard methods and attained a high level of mastery of your chosen strategy or indicators should you consider fully depending on them.
Conclusion
The use and study of forex indicators is a very broad, very complex practice that very few forex traders truly master. Don’t get daunted by this, even masters don’t understand all the types of indicators out there. What you only need to be a successful forex trader in the long term is a strategy that is easy to use, and is profitable for you. It doesn’t matter whether you use three or five indicators.

Leave a Reply